The housing market continues to show positive signs! A new report from CoreLogic reveals a significant increase in homeowner equity across the United States in the first quarter of 2024. This positive trend comes amidst rising home prices and offers welcome relief to many homeowners who were previously underwater on their mortgages. Let’s dive deeper into the report’s findings and explore what they mean for the current housing market.
Homeowner Equity Surges! US Sees $1.5 Trillion Gain in Q1
The CoreLogic Homeowner Equity Insights report is a quarterly publication that covers homeowner equity at the national, state, and metro levels, including negative equity share and average equity gains. This report features an interactive view of the data through digital maps, analyzing CoreLogic homeowner equity data for the first quarter of 2024.
Negative equity, often referred to as being “underwater” or “upside down,” applies to borrowers who owe more on their mortgages than their homes are worth. This situation can arise from a decline in home value, an increase in mortgage debt, or both. This data set includes only properties with a mortgage and excludes those owned outright.
Homeowner Equity in Q1 2024
According to CoreLogic’s analysis, U.S. homeowners with mortgages (approximately 62% of all properties) experienced an increase in equity totaling $1.5 trillion from the first quarter of 2023, reflecting a 9.6% year-over-year gain. Source: 2016 American Community Survey
Year-Over-Year U.S. Home Equity Changes, Q1 2024
In Q1 2024, the total number of mortgaged residential properties with negative equity decreased by 2.1% from the previous quarter, representing 1 million homes or 1.8% of all mortgaged properties. Year-over-year, negative equity fell by 16.1% from 1.2 million homes or 2.1% of all mortgaged properties in Q1 2023.
Home equity is influenced by changes in home prices. Borrowers near the negative equity threshold (+/- 5%) are likely to move into or out of negative equity as home prices fluctuate.
For instance, a 5% increase in home prices would allow 110,000 homes to regain equity, while a 5% decrease would push 153,000 homes underwater. The CoreLogic HPI Forecast predicts a 3.7% increase in home prices from March 2024 to March 2025.
U.S. Negative Home Equity Changes Year Over Year, Q1 2024
California led the U.S. in annual equity gains for Q1 2024. As one of the most expensive states with high housing demand, California homeowners saw the largest equity gain at $64,000, with those in the Los Angeles metro area netting $72,000 year-over-year.
Significant gains were also seen in the Northeast, including New Jersey ($59,000), which has been in the top three for annual appreciation according to CoreLogic’s monthly Home Price Insights report.
National Aggregate Value of Negative Equity: Q1 2024
At the end of Q1 2024, the national aggregate value of negative equity was approximately $321 billion, down $2.8 billion or 1% from Q4 2023, and down $17.6 billion or 5% from Q1 2023. Negative equity peaked at 26% of mortgaged properties in Q4 2009.
Negative Equity Share by U.S. State, Q1 2024
“With home prices continuing to reach new highs, owners are also seeing their equity approach the historic peaks of 2023, close to a total of $305,000 per owner. Importantly, higher prices have also lifted some 190,000 homeowners out of negative equity, leaving only about 1.8% of those with mortgages underwater.
Home equity is key to mortgage holders who have seen other homeownership costs soar, including insurance, taxes and HOA fees, as a source of financial buffer.
Also, low amounts of negative equity are welcomed in markets that have shown price weaknesses this spring, such as Florida (1.1% of homes underwater) and Texas (1.7% of homes underwater) — both of which are below the national rate — as further price declines could drive more homeowners to lose their equity.” – Dr. Selma Hepp, Chief Economist for CoreLogic
National Homeowner Equity
In Q1 2024, the average U.S. homeowner gained approximately $28,000 in equity over the past year. California ($64,000), Massachusetts ($61,000), and New Jersey ($59,000) posted the largest average equity gains. No states experienced annual equity losses.
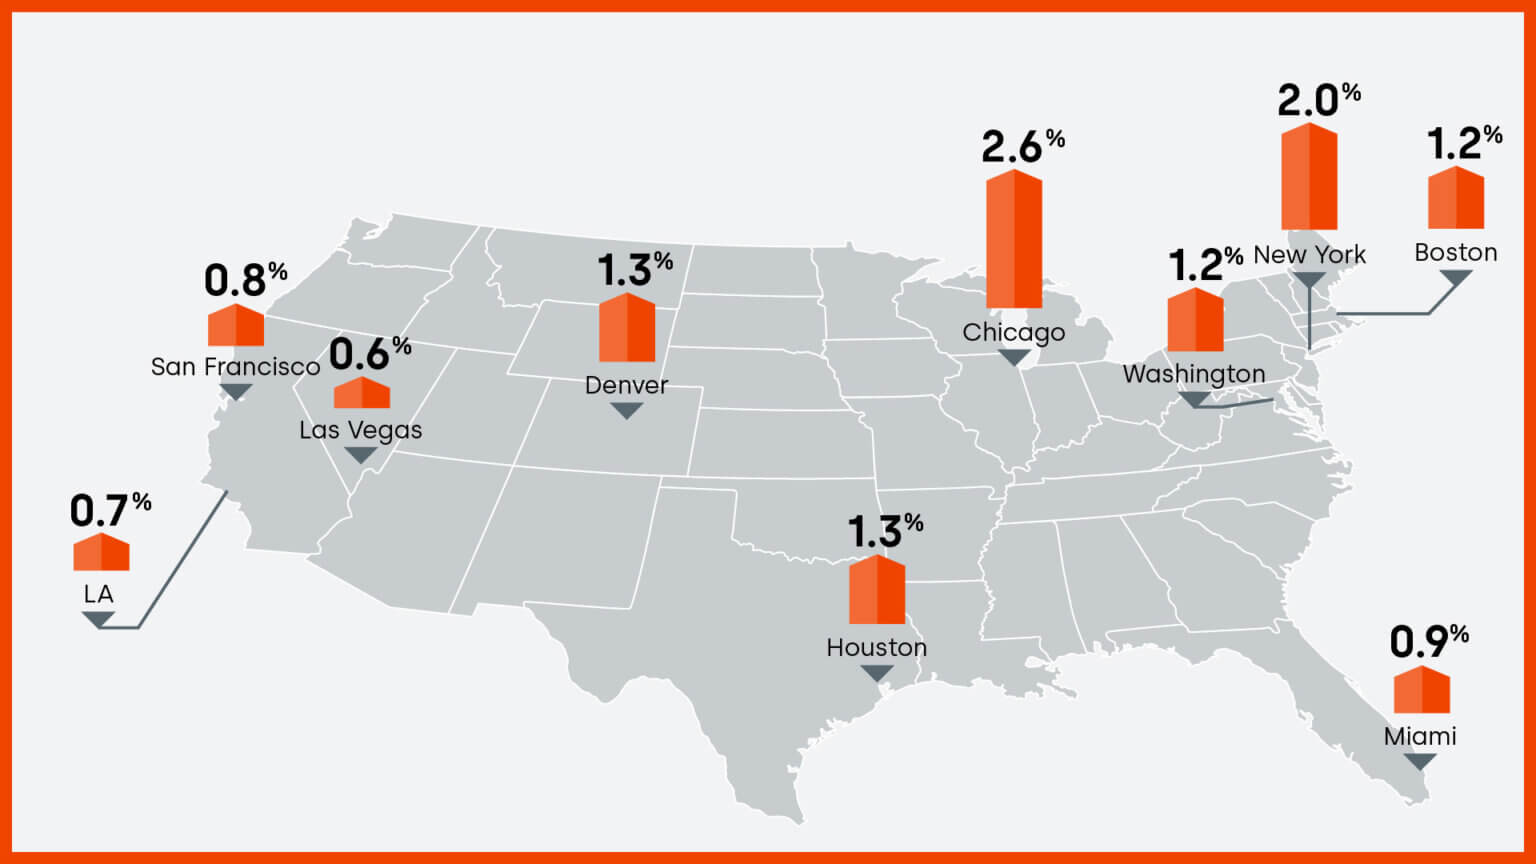
CoreLogic also provides homeowner equity data at the metropolitan level, depicting changes for ten of the largest cities by housing stock. Negative equity has decreased nationwide, with Las Vegas having the lowest negative equity share at 0.6% of all mortgages. It is followed by LA (0.7%), San Francisco (0.8%), and Miami (0.9%).

Summary
CoreLogic began reporting homeowner equity data in Q1 2010, at a time when the equity outlook for homeowners was bleak. Since then, many homes have regained equity, and the outstanding balance on most mortgages is now equal to or less than the loan balance.
ALSO READ:
